VeroLab Light Measuring Services
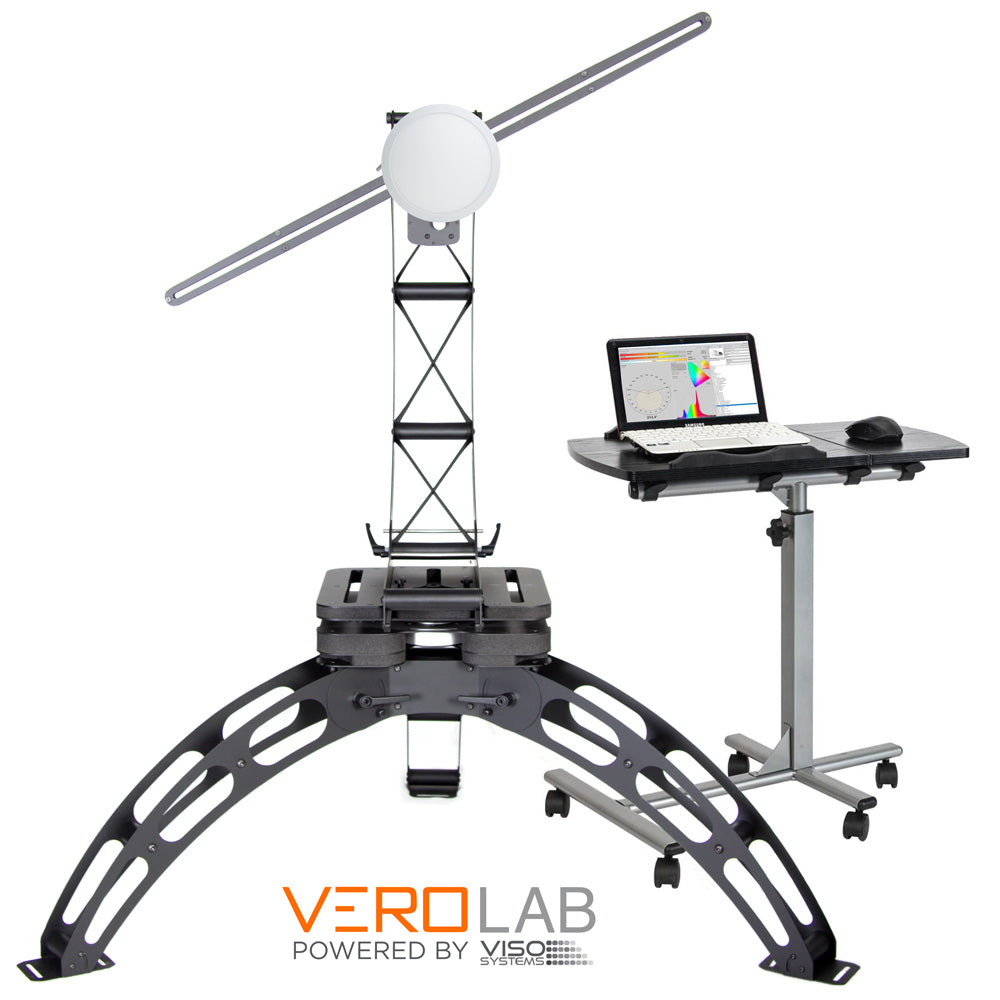
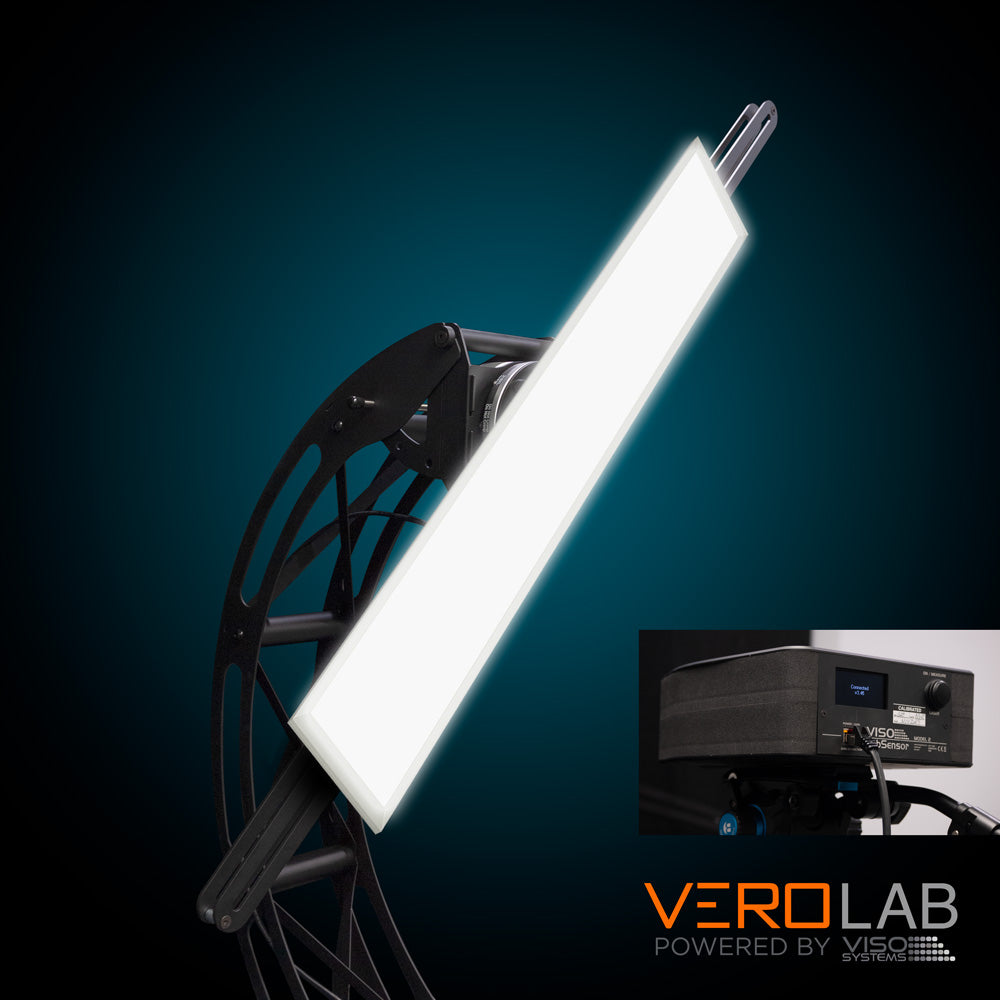
At VeroLab Light Measuring Services with the greatest level of quality and accuracy, we measure all lights utilizing the most cutting-edge, creative light measurement and control technology and provide the most detailed photometric of any lighting product. At VeroLab in Vancouver, Canada, we test all of our products using our completely automated, cutting-edge technology light measuring system in order to produce the most precise specifications for our products and to provide our customers with a clear understanding of each light and better services. At VeroLab, we also offer services to lighting manufacturers, engineers, movie productions, lighting designers, and many others, and provide a broad range of expert testing services for various types of lights that may be tailored to meet their specific needs. Here is an example of a specification sheet made using VeroLab technology:
Sample: Full Photometric Test Report
Contact us for more information:
Email: Verolab@veroboard.com
Phone: +1 (604) 559-5744
Measuring light Outputs
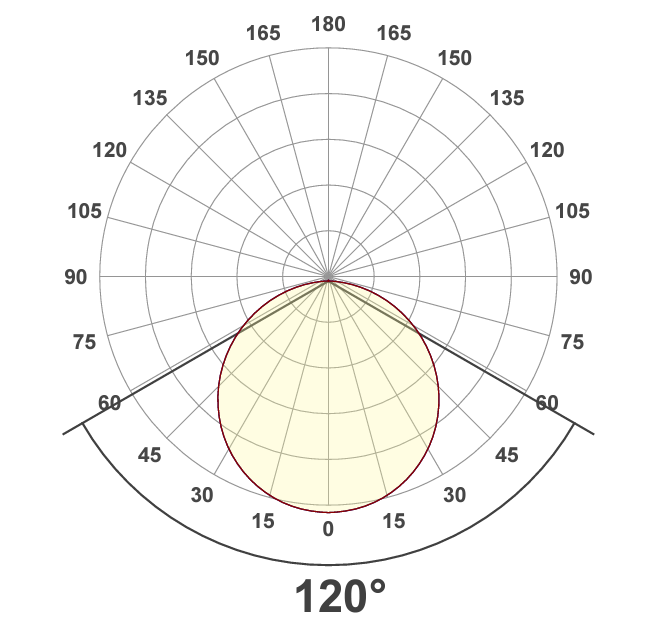
Light distribution curve
Measuring LED service in great detail is no problem. With up to 72 C-planes and up to 0,1 degree gamma resolution, there is data in abundance to plot. 3D plots are included as well.
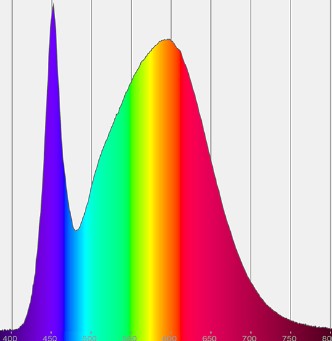
Spectrum
As light is detected with a Viso fast spectrometer sensor, spectral data is recorded in every measurement. A Viso goniometer will even provide ‘color over angle’ data (not possible with an integrating sphere).
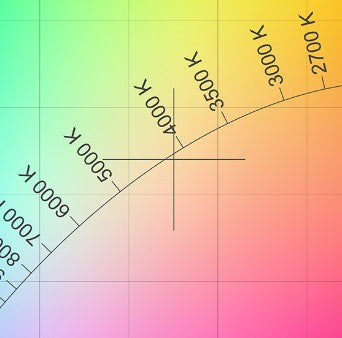
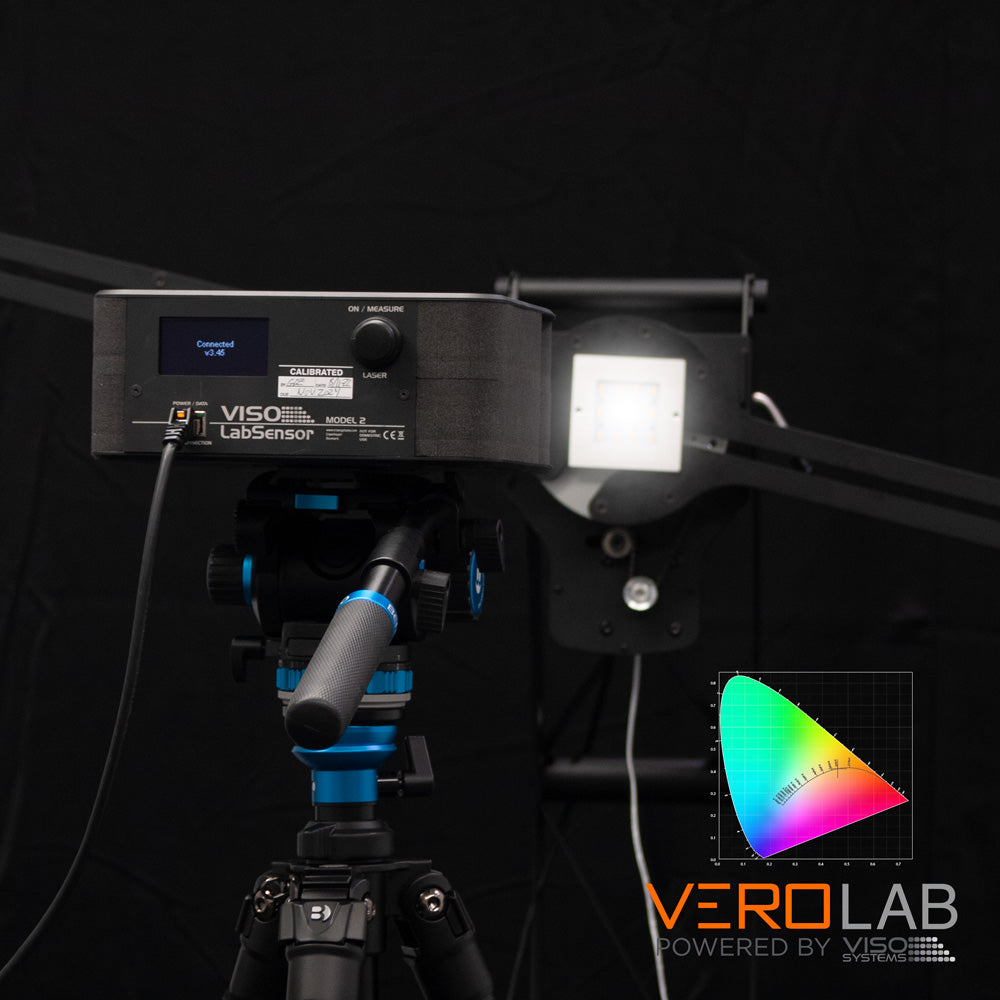
CIE 1931 color coordinate plot
The integrated spectrum can be plotted in a CIE 1931 x,y-diagram. Provide your color target, and the color difference (Duv) and the SDCM value (MacAdam steps) are prompted.
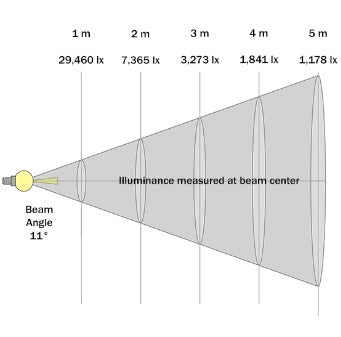
Illuminance plot
Illuminance (lx/foot-candles) in various distances (m/ft) from the light source is often an essential design parameter.
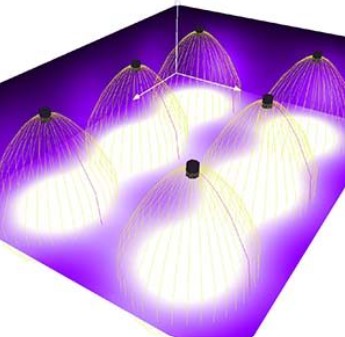
IES/LDT files for light planning
Measuring 3D light distributions enables you to simulate UV lighting distributions and generate high level iso-irradiance diagrams.
YOUR PROFESSIONAL IMAGE
Thorough testing and characterization of your products builds trust. With a lot of detail in your data sheets and presentations, customers will believe in your solutions and your competencies. This true both for your own products and third-party solutions. At VeroLab we makes issuing measurement reports easier than ever. Reports can be fully customized to fit your own corporate identity.
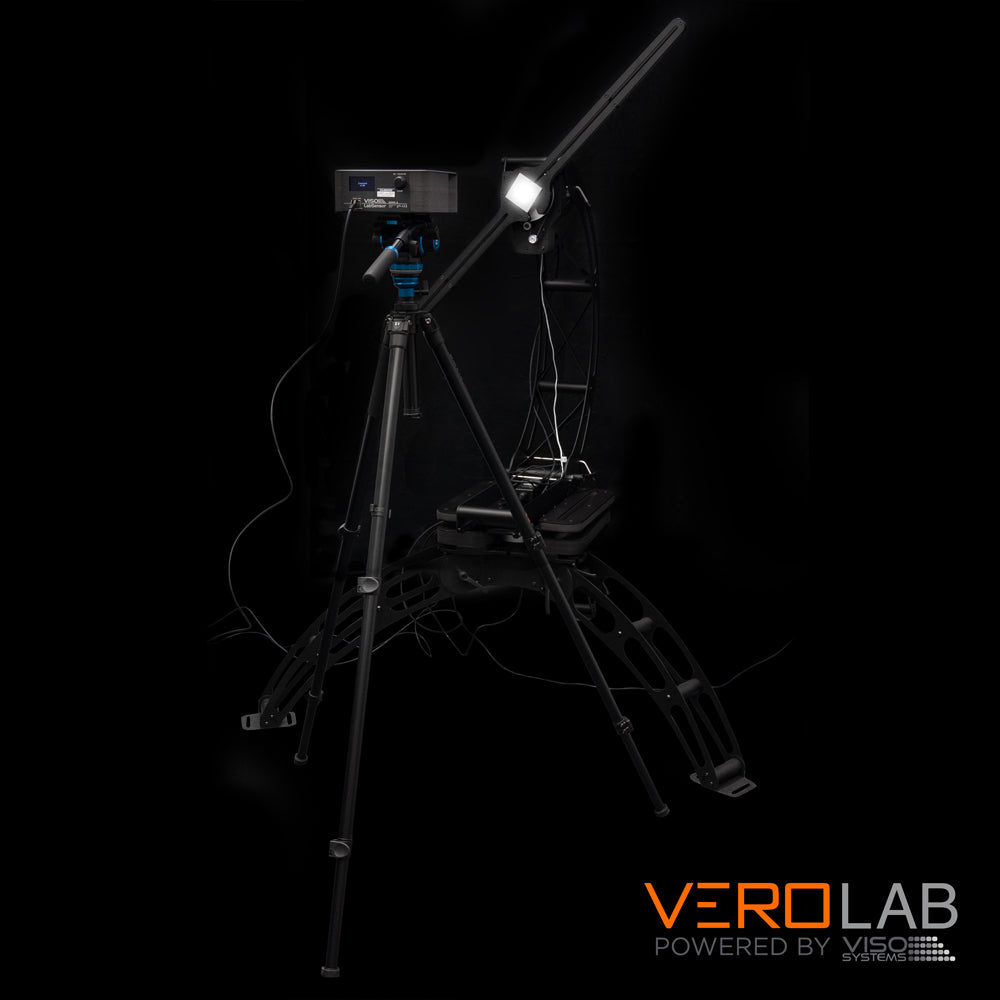
Measure your Lights in VeroLab
General Lighting
General lighting can be defined as the functional and decorative lighting that surrounds us all in our everyday lives.
All professional lighting planners need 3D light files to simulate lighting design in workplaces and public spaces. Consequently, professional providers of general lighting fixtures and light sources need laboratories to the produce so-called IES and LDT files and lots of other data. In addition, extensive color data is needed: CCT, CRI, TM30 etc.
Light Source and LED
Data sheets for LED components (SMD, COB) includes lots of information about the emitted light. Goniometers from Viso Systems capture all information when measuring LED and other light sources. The software handles automatic goniometer setup and measurement. Furthermore, the Light Inspector has extensive output options and connect directly to MATLAB, LabVIEW, etc.
UV Lighting
UV lighting is used for disinfection of surfaces, air and liquids. Further, UV lighting has a lot of industrial applications, such as curing of glue, polymers and prints. UV Light is also used for various kinds of light therapy and UV tanning.
No matter the application, an important parameter is “dose time” – the exposure with certain wavelengths over time. Germicidal effects are not acute but depend on exposure. Curing of prints and glues is equally dependent on dose time.
Growth Lighting
Horticultural lighting is the standard term used when lights are used for growing plants. Instead of lumen, data is displayed in the PPF value: PPF represents the number of photons radiated by a light source in the photosynthetically active wavelength interval 400-700 nm.
You might think this kind of data is not necessary for general lighting applications. However, if you work on illuminating open spaces like hotel lobbies, which include plants in the architecture, you might be required to specify PPF values.
Entertainment Lighting
Entertainment lighting has developed into a complex field of solutions including video, lighting and control technology that provide and facilitate great visual experiences in sporting events, concerts, museums, film, TV, convention centers etc.
Professional providers of lighting equipment must support clients with lots of photometric data.
Automative and Signal Lighting
Specific photometric tests and measurements are required by automotive and transportation lighting standards including Rail, Aviation and Marine lighting. Viso Systems offers instruments and special dedicated software for a full characterization of light intensity distribution, flicker and colorimetry.
More Outputs
Fundamental radiation data
Total lumen
Peak Candela
Beam angle
LOR Up/Down
Polar light distribution curves
Linear light distribution curves
Color and color deviation data
CCT / Correlated Color Temp. [K]
CRI / Color Rend. Index / Ra (1-14)
TM30-18 indices and graphics
CQS index and graphics
CIE 1931 x,y-diagram and Duv
SCDM (MacAdam steps)
Lighting design and data export
UGR table
Isolux/iso-candela plots
BUG rating
Full raw data export to MS Excel etc.
Optional web-based tracking system
Customizable PDF reports
Power and warm-up data
Wattage [W]
Current [A] and voltage [V]
Mains frequency [Hz]
Current and voltage THD [%]
Warm-up time and variation
Automatic stabilization
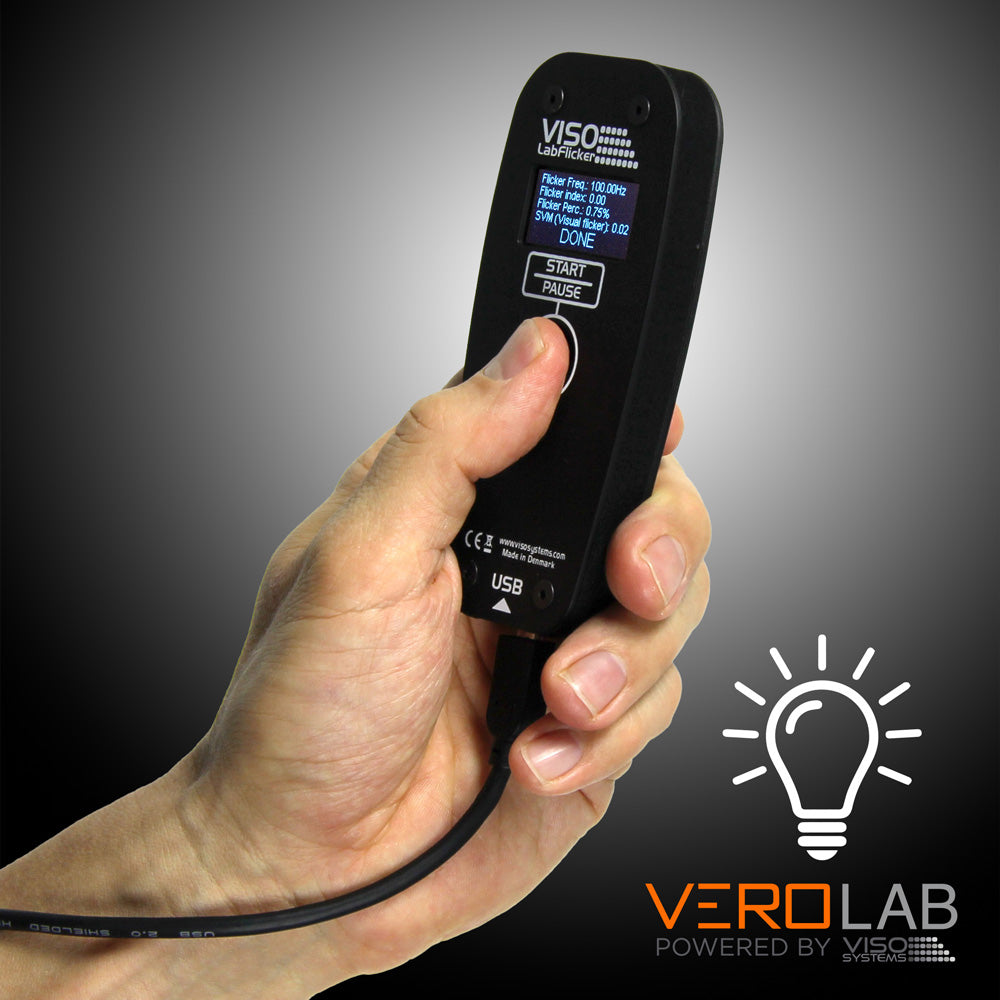
VeroLab Flickering Test
The LabFlicker is a semi-handheld flicker tester for all common light sources. All relevant flicker graphics and metrics – including SVM and PstLM – are displayed.
It connects directly to the Light Inspector software giving you live preview of your flicker signal. The LabFlicker instrument can be used with any PC – with or without a Viso goniospectrometer. As a result, LabFlicker is ideal for laboratories that need to comply with the EU Ecodesign directive or US Energy Star requirements ( Bulbs / Luminaires). The smart signal processing algorithm frames and calculates your flicker data in real-time.